Make-to-Stock VS Make-to-Order: Demystifying the Inventory Decision with ABC-XYZ Analysis
Writer: Muhammad Ramadhan Agya
Making the Right Call: Make-to-Stock vs. Make-to-Order
Every manufacturer wrestles with a key question: build products in advance (make-to-stock) or wait for customer orders (make-to-order)? Thankfully, the answer can be straightforward sometimes. Bespoke items, for instance, naturally fall under make-to-order – you can’t start production without knowing the exact specifications. However, for standard products, there’s always room for flexibility.
The choice between make-to-stock and make-to-order hinges heavily on sales volume and its variability. Businesses can leverage analytical tools like Pareto analysis (ABC) or ABC-XYZ analysis to make informed choices. While ideally, we’d consider both quantity and fluctuation, data is often simplified into two, three (ABC), or nine (ABC-XYZ) groups for easier management.
ABC Analysis: Prioritizing Inventory
ABC analysis seems like a handy tool, but it relies solely on item value, which can be shortsighted. This prioritization method, while influencing inventory selection and focus areas, overlooks other crucial aspects of effective inventory management. Think of ABC as a simplified Pareto analysis. It categorizes items into three tiers: A (highest value), B (medium value), and C (lowest value). However, there’s no universally agreed-upon split for these categories. The common approach is 80/20 (20% A, 30% B, 50% C), but variations like 70/20/10 exist. This inconsistency highlights the somewhat arbitrary nature of this grouping, which ultimately depends on your specific needs.
XYZ Analysis: Demystifying Demand Volatility
XYZ analysis goes beyond simply categorizing inventory. It dives into the demand volatility for each item. This allows businesses to strategically plan material needs and stock levels, minimizing waste, production delays, and overflowing warehouses. Essentially, XYZ analysis gauges how well you can predict consumption and demand. The Three Faces of Demand:
- Steady and Predictable (X-items): These rockstars experience minimal sales fluctuations, making future demand a breeze to forecast.
- Somewhat Variable (Y-items): Demand for Y-items follows recognizable patterns, influenced by factors like seasonality, product lifespans, competitor activity, or economic trends. Predicting demand becomes trickier here.
- Highly Unpredictable (Z-items): Buckle up! Z-items exhibit wildly varying or sporadic demand, with no discernible trends or clear causes. Forecasting demand for these is practically impossible.
ABC-XYZ Analysis: A Powerful Combination
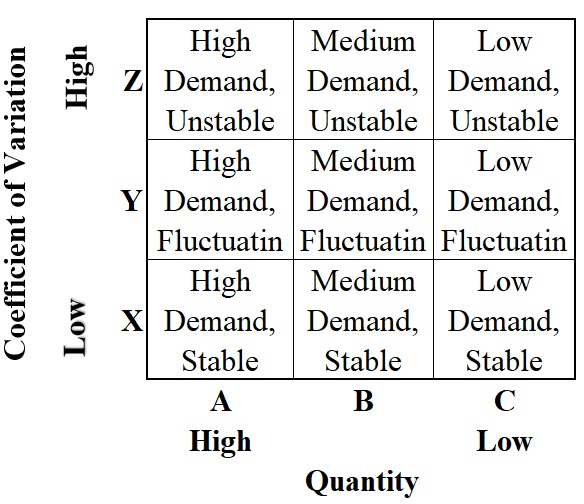
ABC-XYZ analysis combines the strengths of both analyses. The ABC part prioritizes items based on quantity or value (depending on your needs), grouped into three categories. The XYZ part captures demand fluctuations, also grouped into three categories (X-stable, Y-somewhat variable, Z-highly unpredictable). The coefficient of variation (standard deviation divided by the mean) is a good measure for XYZ analysis, as it considers both fluctuation and absolute quantity.
Making Smarter Inventory Decisions

Overall, ABC-XYZ analysis helps classify inventory based on both volume and stability. This allows you to make more informed ordering and stocking decisions. For example, high-volume, stable products (AX) likely require different strategies compared to erratic-demand, low-volume items (CZ). By understanding demand patterns, you can optimize safety stock levels. Products with predictable demand (X items) can have lower safety stock compared to those with volatile demand (Z items). By incorporating both volume and demand variability, ABC-XYZ analysis empowers manufacturers to make data-driven decisions for their make-to-stock versus make-to-order strategies, ultimately leading to a more efficient and optimized inventory management system.
Reference:
ABC-/XYZ-Analysis (remira.com)
Make-to-Order vs Make-to-Stock: The ABC XYZ Analysis | AllAboutLean.com
What is ABC XYZ inventory analysis & How can it add value? (eazystock.com)


Comments :